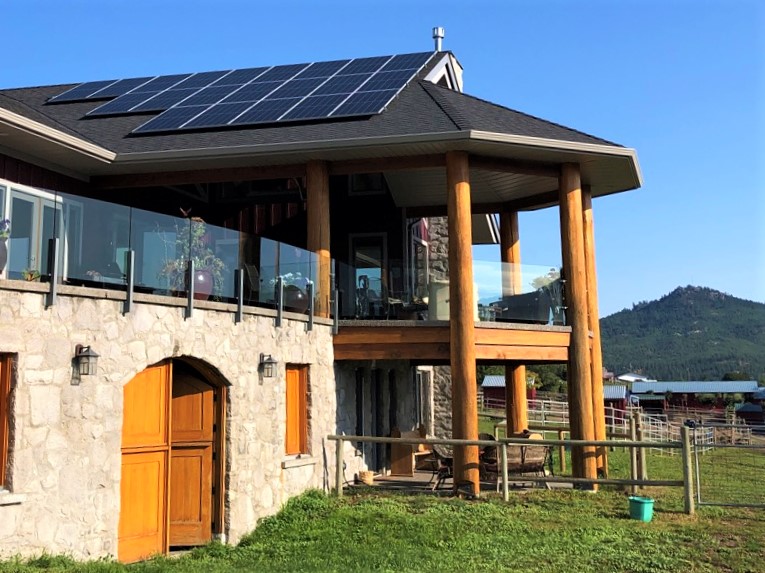
Quality solar, battery, and energy systems
designed for the Thompson Okanagan.
Built with care. Installed with integrity.
Engineered to deliver clean power for
decades.
Once a solar system is turned on, many homeowners assume the job is done. In reality, understanding how your system performs day to day is what protects your investment long term. That is where solar array monitoring becomes essential.
For homeowners across Vernon and the Okanagan, monitoring is not just about seeing how much power your panels produce. It is about understanding how that energy interacts with your household usage and the local utility. In this article, we will explain how manufacturer monitoring platforms like SolarEdge and APSystems work, and how the Roost Solar monitoring dashboard adds an additional layer of insight for eligible customers.
At its core, solar array monitoring is the process of tracking how much electricity your solar system produces over time. Modern monitoring platforms allow homeowners and installers to confirm that panels, inverters, and microinverters are operating as expected.
Monitoring data is typically presented over different time periods such as hourly, daily, monthly, or annually. This makes it easier to spot changes in performance, confirm seasonal trends, and identify potential issues early.
For most systems in the Okanagan, monitoring is built into the inverter or microinverter equipment installed with the array.
SolarEdge systems use a centralized inverter paired with panel level optimizers. Each optimizer tracks the performance of its individual panel and reports data back to the inverter.
Through the SolarEdge monitoring portal, homeowners can view:
SolarEdge monitoring focuses primarily on production. It shows how much electricity the system generates but does not show how that energy is used inside the home or how much is imported from or exported to the grid.
This production visibility is a foundational part of solar array monitoring, but it represents only one side of the energy picture.
APSystems uses microinverters, meaning smaller inverters are installed under the panels on the roof, instead of one large centralized inverter. Each microinverter reports production data independently to the APSystems monitoring portal.
APSystems monitoring provides:
Like SolarEdge, APSystems monitoring is focused on generation. It is an effective way to confirm that every panel in the array is contributing as expected, especially in complex roof layouts common throughout the Okanagan.
For eligible customers, Roost Solar provides an additional monitoring layer that builds on manufacturer data.
The Roost Solar dashboard combines:
To enable this, customers grant Roost Solar read only access to their BC Hydro usage data. This allows the dashboard to display solar production alongside grid imports and exports over the same time period.
This approach to solar array monitoring allows homeowners to see:
The result is a clearer, more complete picture of household energy flow rather than production alone.
The Roost Solar monitoring dashboard is not available for every system. It is intentionally limited to ensure accuracy.
The dashboard is available only to:
Customers served by Fortis Electric are not eligible because the dashboard relies on BC Hydro data access.
The dashboard also complements manufacturer monitoring rather than replacing it. SolarEdge and APSystems portals remain the primary source for detailed equipment level diagnostics, while the Roost dashboard focuses on energy flow and usage context.
This layered approach strengthens solar array monitoring without overcomplicating it.
Get a free estimate for your property
Energy usage patterns in the Okanagan vary widely across seasons. Long summer days, electric vehicle charging, heating loads, and changing household behavior all affect how solar energy is used.
Effective solar array monitoring helps homeowners:
Monitoring also supports long term system reliability by helping identify issues early before they affect annual production.

Is solar array monitoring included with every solar installation?
Monitoring through SolarEdge or APSystems is included when those products are installed. The Roost Solar dashboard is available only to eligible BC Hydro customers using compatible equipment.
Does the Roost Solar dashboard replace SolarEdge or APSystems apps?
No. The Roost dashboard complements manufacturer monitoring by combining production data with BC Hydro import and export data.
Can I control my solar system through the monitoring dashboard?
Monitoring platforms are designed for visibility, not control. They show performance and energy flow but do not control system operation.
Why can’t Fortis Electric customers use the Roost dashboard?
The dashboard relies on read only access to BC Hydro data. Fortis Electric uses a different utility data structure that is not compatible.
How often is monitoring data updated?
Data can be viewed over hourly, daily, or monthly periods depending on the platform and data source.
Production alone does not tell the whole story. Understanding how your solar energy is generated, consumed, and exported is what turns data into insight.
For Roost Solar customers in the Okanagan with eligible systems, combining manufacturer monitoring with the Roost Solar dashboard creates a more meaningful approach to solar array monitoring. It brings clarity, transparency, and confidence to solar ownership long after installation is complete.

5101 25th Ave, Vernon, BC


